Once you’ve acquired users, you can use the Behavior reports to see how your users engage with your app. Each of the Behavior reports contains information about the types of actions a user takes. This could include screen views, interactions within a screen, and what crashes and exceptions they encounter. The Behavior reports can help you learn which behaviors are most common for your high- and low-value users. Let’s explore some of the Google Analytics Behavior reports in AdMob: https://analyticsacademy.withgoogle.com/course04/unit?unit=3&lesson=1
In the navigation pane, click Screens. The Screens report evaluates the performance of each screen in your app, breaking out metrics like Screen Views, Unique Screen Views, Average Time on Screen, and the percentage of time users exit the app from a screen. These metrics allow you to see which screens users engage with the most.
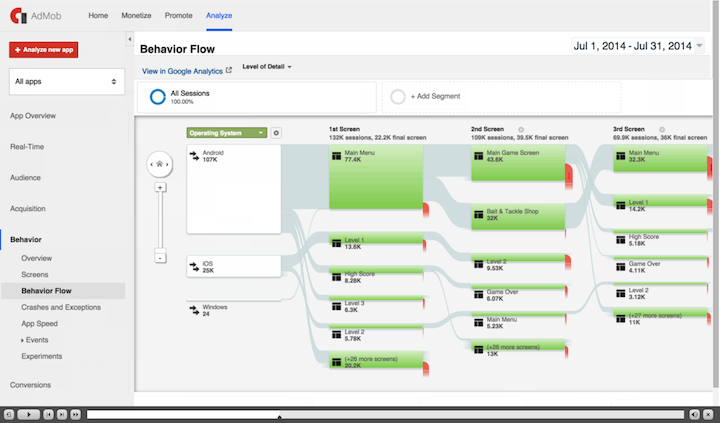
Next, click Behavior Flow. The Behavior Flow report shows the path that users travel through your app from one Screen or Event to the next. For example, you could see which Screens lead Go Fish! users into the in-app store most often. This can help you understand the order in which users experience content to keep them engaged.
Now click Crashes and Exceptions. This report shows the top exceptions or technical errors that occurred in the various versions of your app with crashes automatically parsed out from other exceptions. You can also define more exception types in your app tracking code if you want to get more detail. For example, you may want to specifically define exceptions such as “network failures” or “empty search results” to understand which devices or operating systems cause these errors.
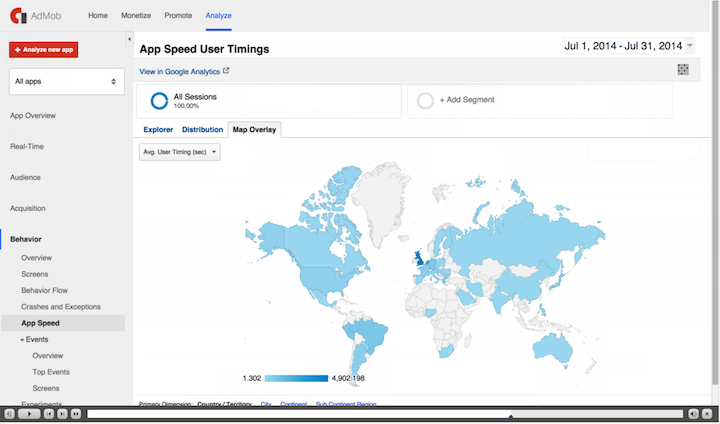
Next click App Speed. App Speed reports show how long different requests take to load in your app. You may want to track how quickly the screens for each level of your game load or how fast search results are returned. You can also toggle between versions of this report including Explorer, Distribution, and Map overlay.
In the Explorer tab, User Timing measures the length of specific tasks in an app like how long it takes a high score to load or how long it takes users to get past the first level of a game. The Timing Category displays the category name you’ve defined for a specific type of task you’re tracking. The Average User Timing metric shows the average length of time it takes for that task to be completed. For each User Timing, you can define category, name, and label parameters to help you organize this data in your reports. This must be set up as part of your implementation.
In the Distribution tab, you can see the percentage of tasks that fall into each User Timing Bucket, which communicates how long it typically takes tasks in your app to be completed.
Now click Map Overlay. The Map Overlay tab shows the global distribution of Average User Timing with darker shades indicating longer load times. This report can show if your app experiences performance issues in particular geographic regions.
Now click Events. Then click Top Events. Events are used to collect data about interactions your users have within the screens of your app, like initiating downloads, clicking on an ad, or making a social recommendation. The “Top Events” report displays data on all of your events, sorted by the most common.
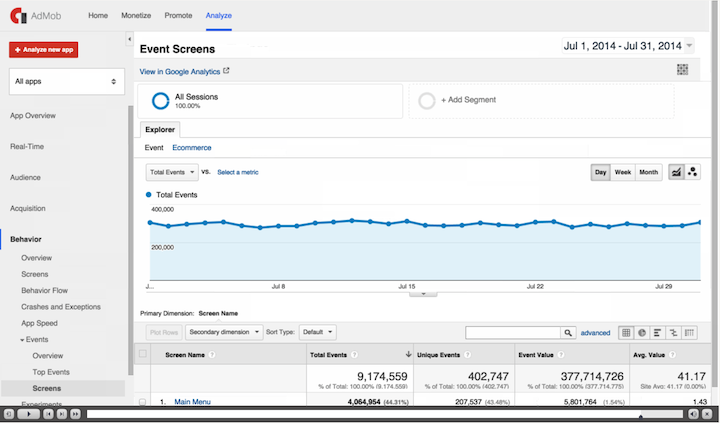
Under Events, click the Screens report. The Screens report shows which screens users are on when they initiate one of the events tracked within an app. Note that you must set up additional event tracking in your implementation to view Events data in the Events reports.
Keep in mind, you can apply the user segments you created in the previous unit to any of these reports to show how well high- and low-value users engage with your app. This can help you get valuable insight into users’ behavior and the app’s performance.
--
- Overview of mobile app Behavior reports
- Crashes and Exceptions reporting for Android and iOS
- About Site Speed
- User Timing for Android and iOS
- Sessions Overview for Android and iOS


